Case study: Creating signal power coverage maps
This document provides a first test on the creation of signal power coverage maps.
The goal is to test the usefulness of a portable system, capable of recording the frequency spectrum with time stamp and GPS information.
The setup consisted on:


The goal is to test the usefulness of a portable system, capable of recording the frequency spectrum with time stamp and GPS information.
The setup consisted on:
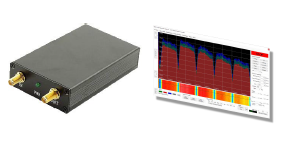
- A laptop running the "SMA Simple Spectrum Analyser" software
- The SMA "138MHz-4.4GHz 35M-4.4G USB SMA Source/Signal Generator/Simple Spectrum Analyzer" device
- A Blutooth GPS receiver
- A suitable antenna
The software records continously the spectrum of the selected frequency range, adding the GPS position and the current time to the file.
This recorded spectrum can later be played back and individual single frequency logs can be created, which will inherit the corresponding GPS position.
The following pictures show the resulting single frequency logs plotted on Google Maps - all within the "SMA Simple Spectrum Analyser" software.

Picture1: The spectrum of the selected frequency range.

Picture2: The same spectrum rendered as a waterfall diagram - the playback of the recorded spectrum is continous, hence the repeating patterns.

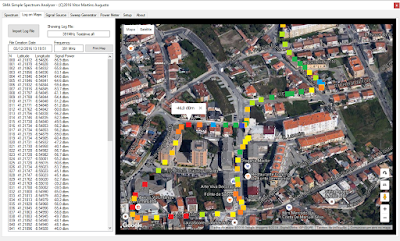
Picture 3: Showing the measurements at 318MHz in Map View on Google Maps. Reception is only possible in limited positions.

Picture 4: Showing the at 391MHz in SatelliteView on Google Maps. In the left lower corner is the local fire fighter base. Their transmissions at 318MHz are notorious for causing interference on NOS (TV CABO ) CATV networks: the analogue channel at 327.5MHz (CNN) will be received in bad conditions in home near this fire fighter base. The measurement map can be used to determine the extend of these interferences.

Picture 5: Showing the measurements at 397MHz in Satellite View on Google Maps. This allows easy correlation to reception against obstacles like buildings.

Picture 6: Showing measurements at 468MHz. Interestingly this picture show the potential to locate a transmission source. This makes it ideal to track i.e. illegal transmissions.
Conclusion:
- The setup allows to display signal power of a single frequency in a comprehensive maps view.
- The resulting mapped data can be used to determine reception quality within an area.
- It can be used to locate a transmitter.
- It can be used to determine the effect of local obstacles like buildings, trees or mountains.
- The setup is fairly easy and cost effective.
Problems:
- In order to create usable spectrum recordings, a propper omnidirectional antenna has to be used. This may constitute a problem, but since the car in movement does not always point to the same direction, there is no alternative other than possibly a real-time self orienting antenna.
- The Bluetooth GPS receiver can be difficult to pair and sync to the laptop. A GPS receiver with RS-232 interface is more reliable.
- The whole setup involves several devices and cables. Hence it is very distracting for the driver and prone to errors due to moving parts. It is recommended to build a suitable fixture for all components and have the laptop set out of view in regards to the driver.
Author: Vitor Martins Augusto - December, 3rd 2016

Comments
Post a Comment